Driving impact through data across website redesign phases
As a full service digital strategy, design, and development agency, we approach website analytics through the different perspectives we bring to the table. As a strategist, my focus is primarily on the types of data you can leverage in analytics. I work with our mission-driven clients to jump into their existing analytics to understand their current website engagement, as well as planning how they can measure the success and impact of any goals they set for their new site. By creating clear metrics for defining success, our team ensures organizational and user goals are being carried from planning, through the site’s design and build, and into an impactful future website.
Once we’ve defined a site’s Key Performance Indicators (KPI’s), I work closely with our design team to ensure that key interactions for driving success are clearly designed to guide users to those actions. As we get closer to launching the site, our strategy and development teams collaborate around configuring the analytics to track those KPI’s we determined early on in the project.
I’m going to walk through the types of user data you can gather across analytics tools on your existing site. If you’re interested in learning more from an implementation perspective, take a look at a recent blog post from our VP of Engineering, Joel Steidl, about the transition from Universal Analytics to Google Analytics 4.
Types of Data & Data Sources
Let’s start by talking about the variations between types of qualitative and quantitative user data we typically use with mission-driven organizations.
Qualitative data measures the quality of users’ experience and why people are doing what they do. Through conversational input across interviews, workshops, and open-response questionnaires, qualitative data analysis gathers trends in key opportunities for improving the website.
Quantitative data measures what people are doing or prefer in numerical quantities. This enables a broader range of input from sources like analytics, surveys, and census data.
We’ll primarily be focusing on quantitative data as a decision-driver with a focus on web analytics that can be accessed without building complex reports. But first, let’s dive into data you can gather without getting into any analytics at all.
Census Data
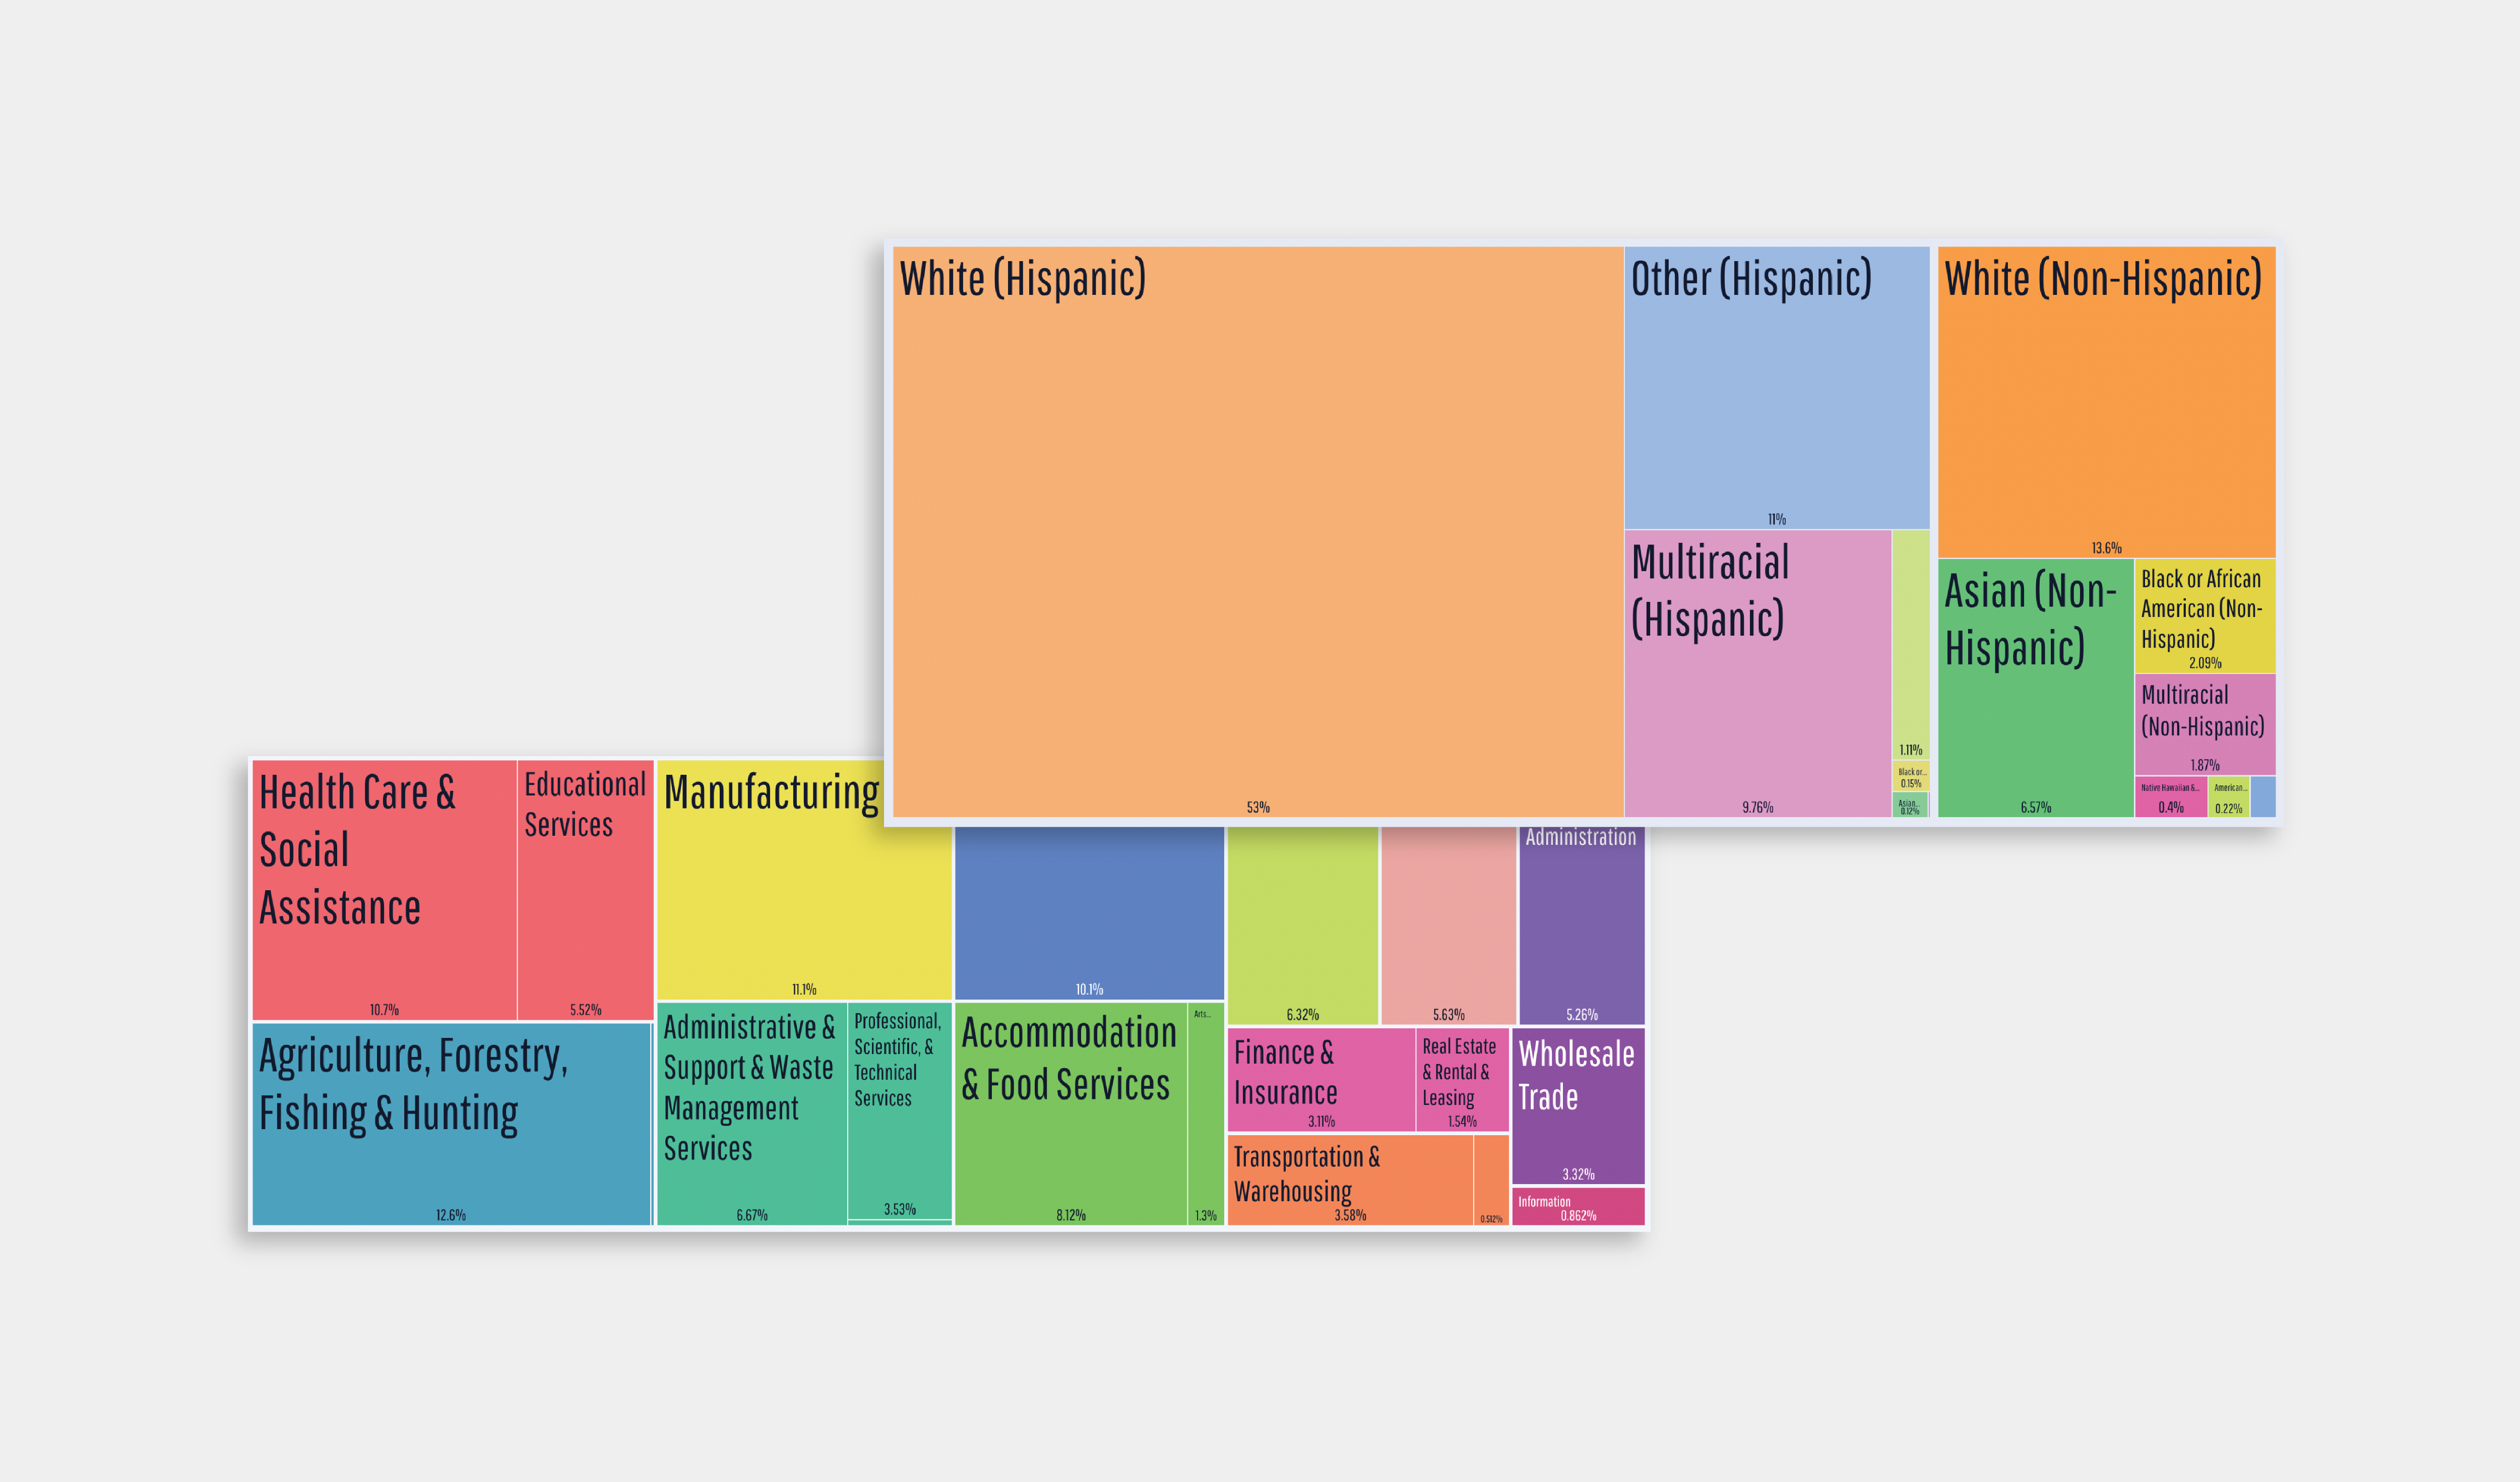
Typically when starting a municipal or location-based project, we use census data visualized through DataUSA.io to get a sense for the unique qualities of a city, state, or region.
For example, when working with the city of Oxnard, CA, we got a sense for what industries shaped the area’s population, as well as the cultural diversity in the area as you can see in the visualization below. These insights informed our focus on user outreach, iconography, and copy guidelines later in the project.
Survey Data
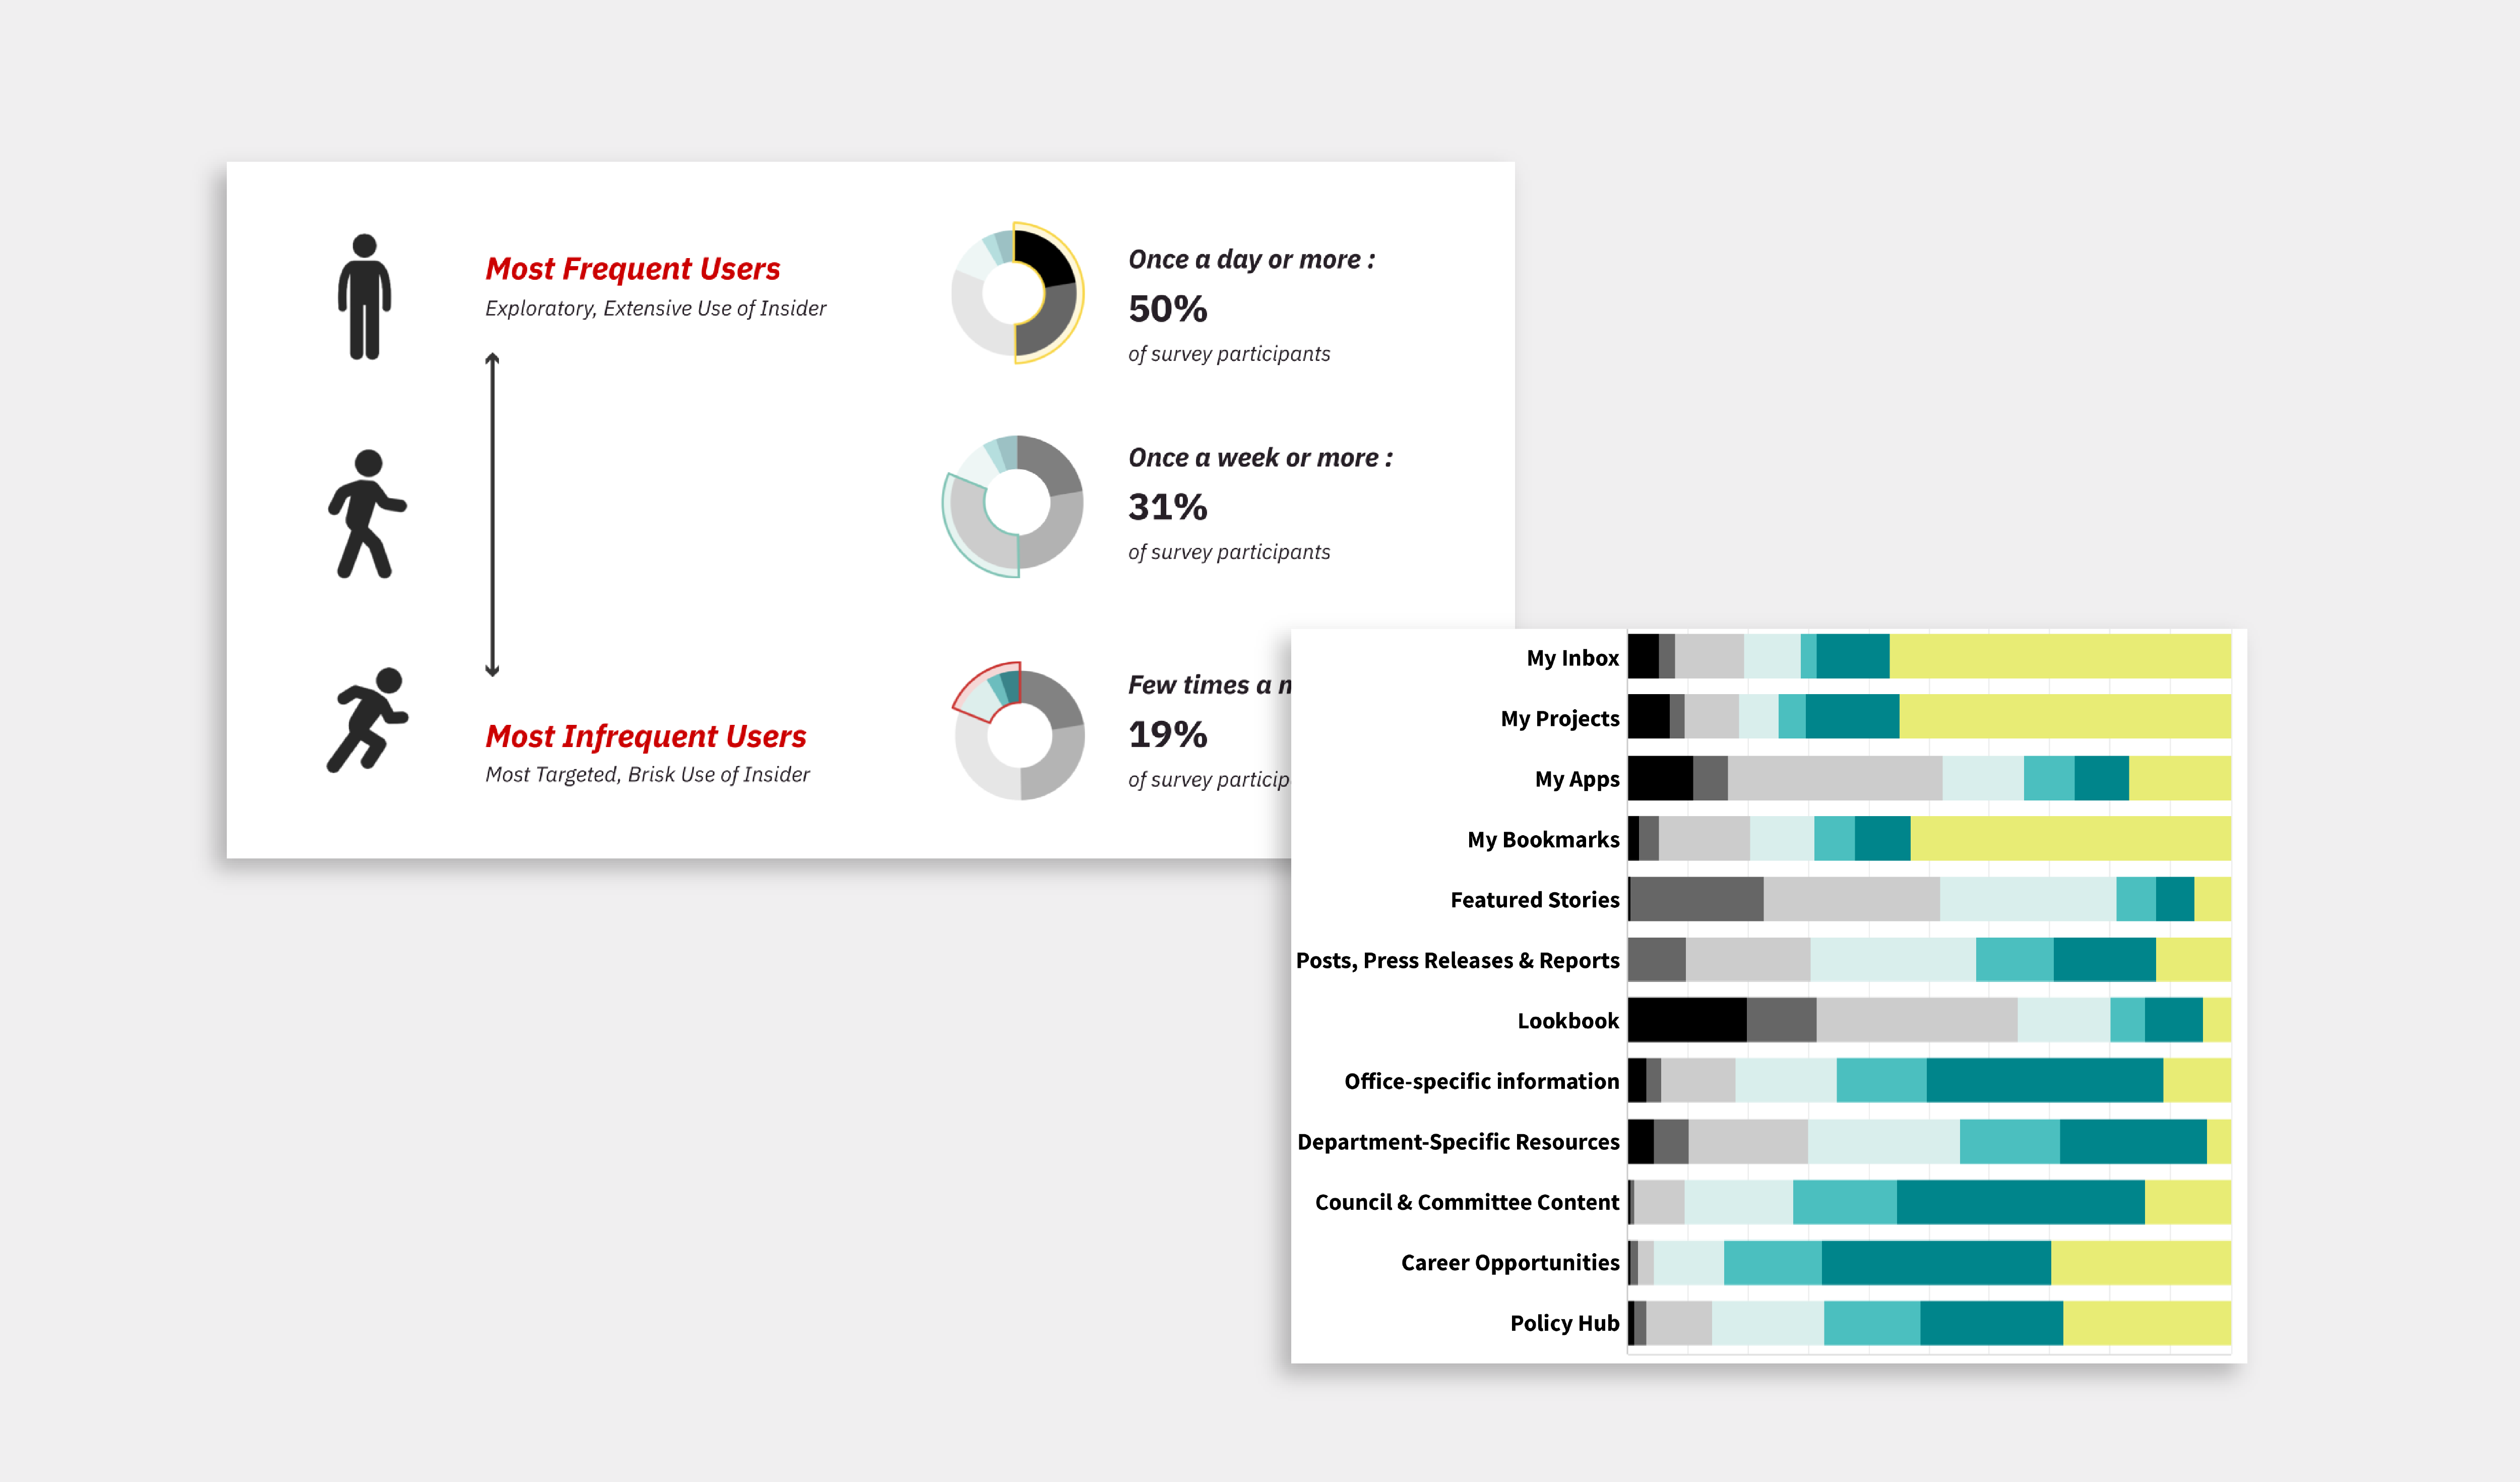
Another primary source of data collection that we utilize is survey data, often customized to the scale of the group being engaged. If we are surveying over 50 people, we typically utilize multiple choice questions to both increase engagement and ensure that we can easily export and analyze the data at a large scale.
What You Can Learn Across Analytics Tools
Website user analytics doesn’t have to be a vague, overwhelming tool that requires complex data analytics. All of the types of information shown here is information you can find yourself without creating complex dashboards or reports.
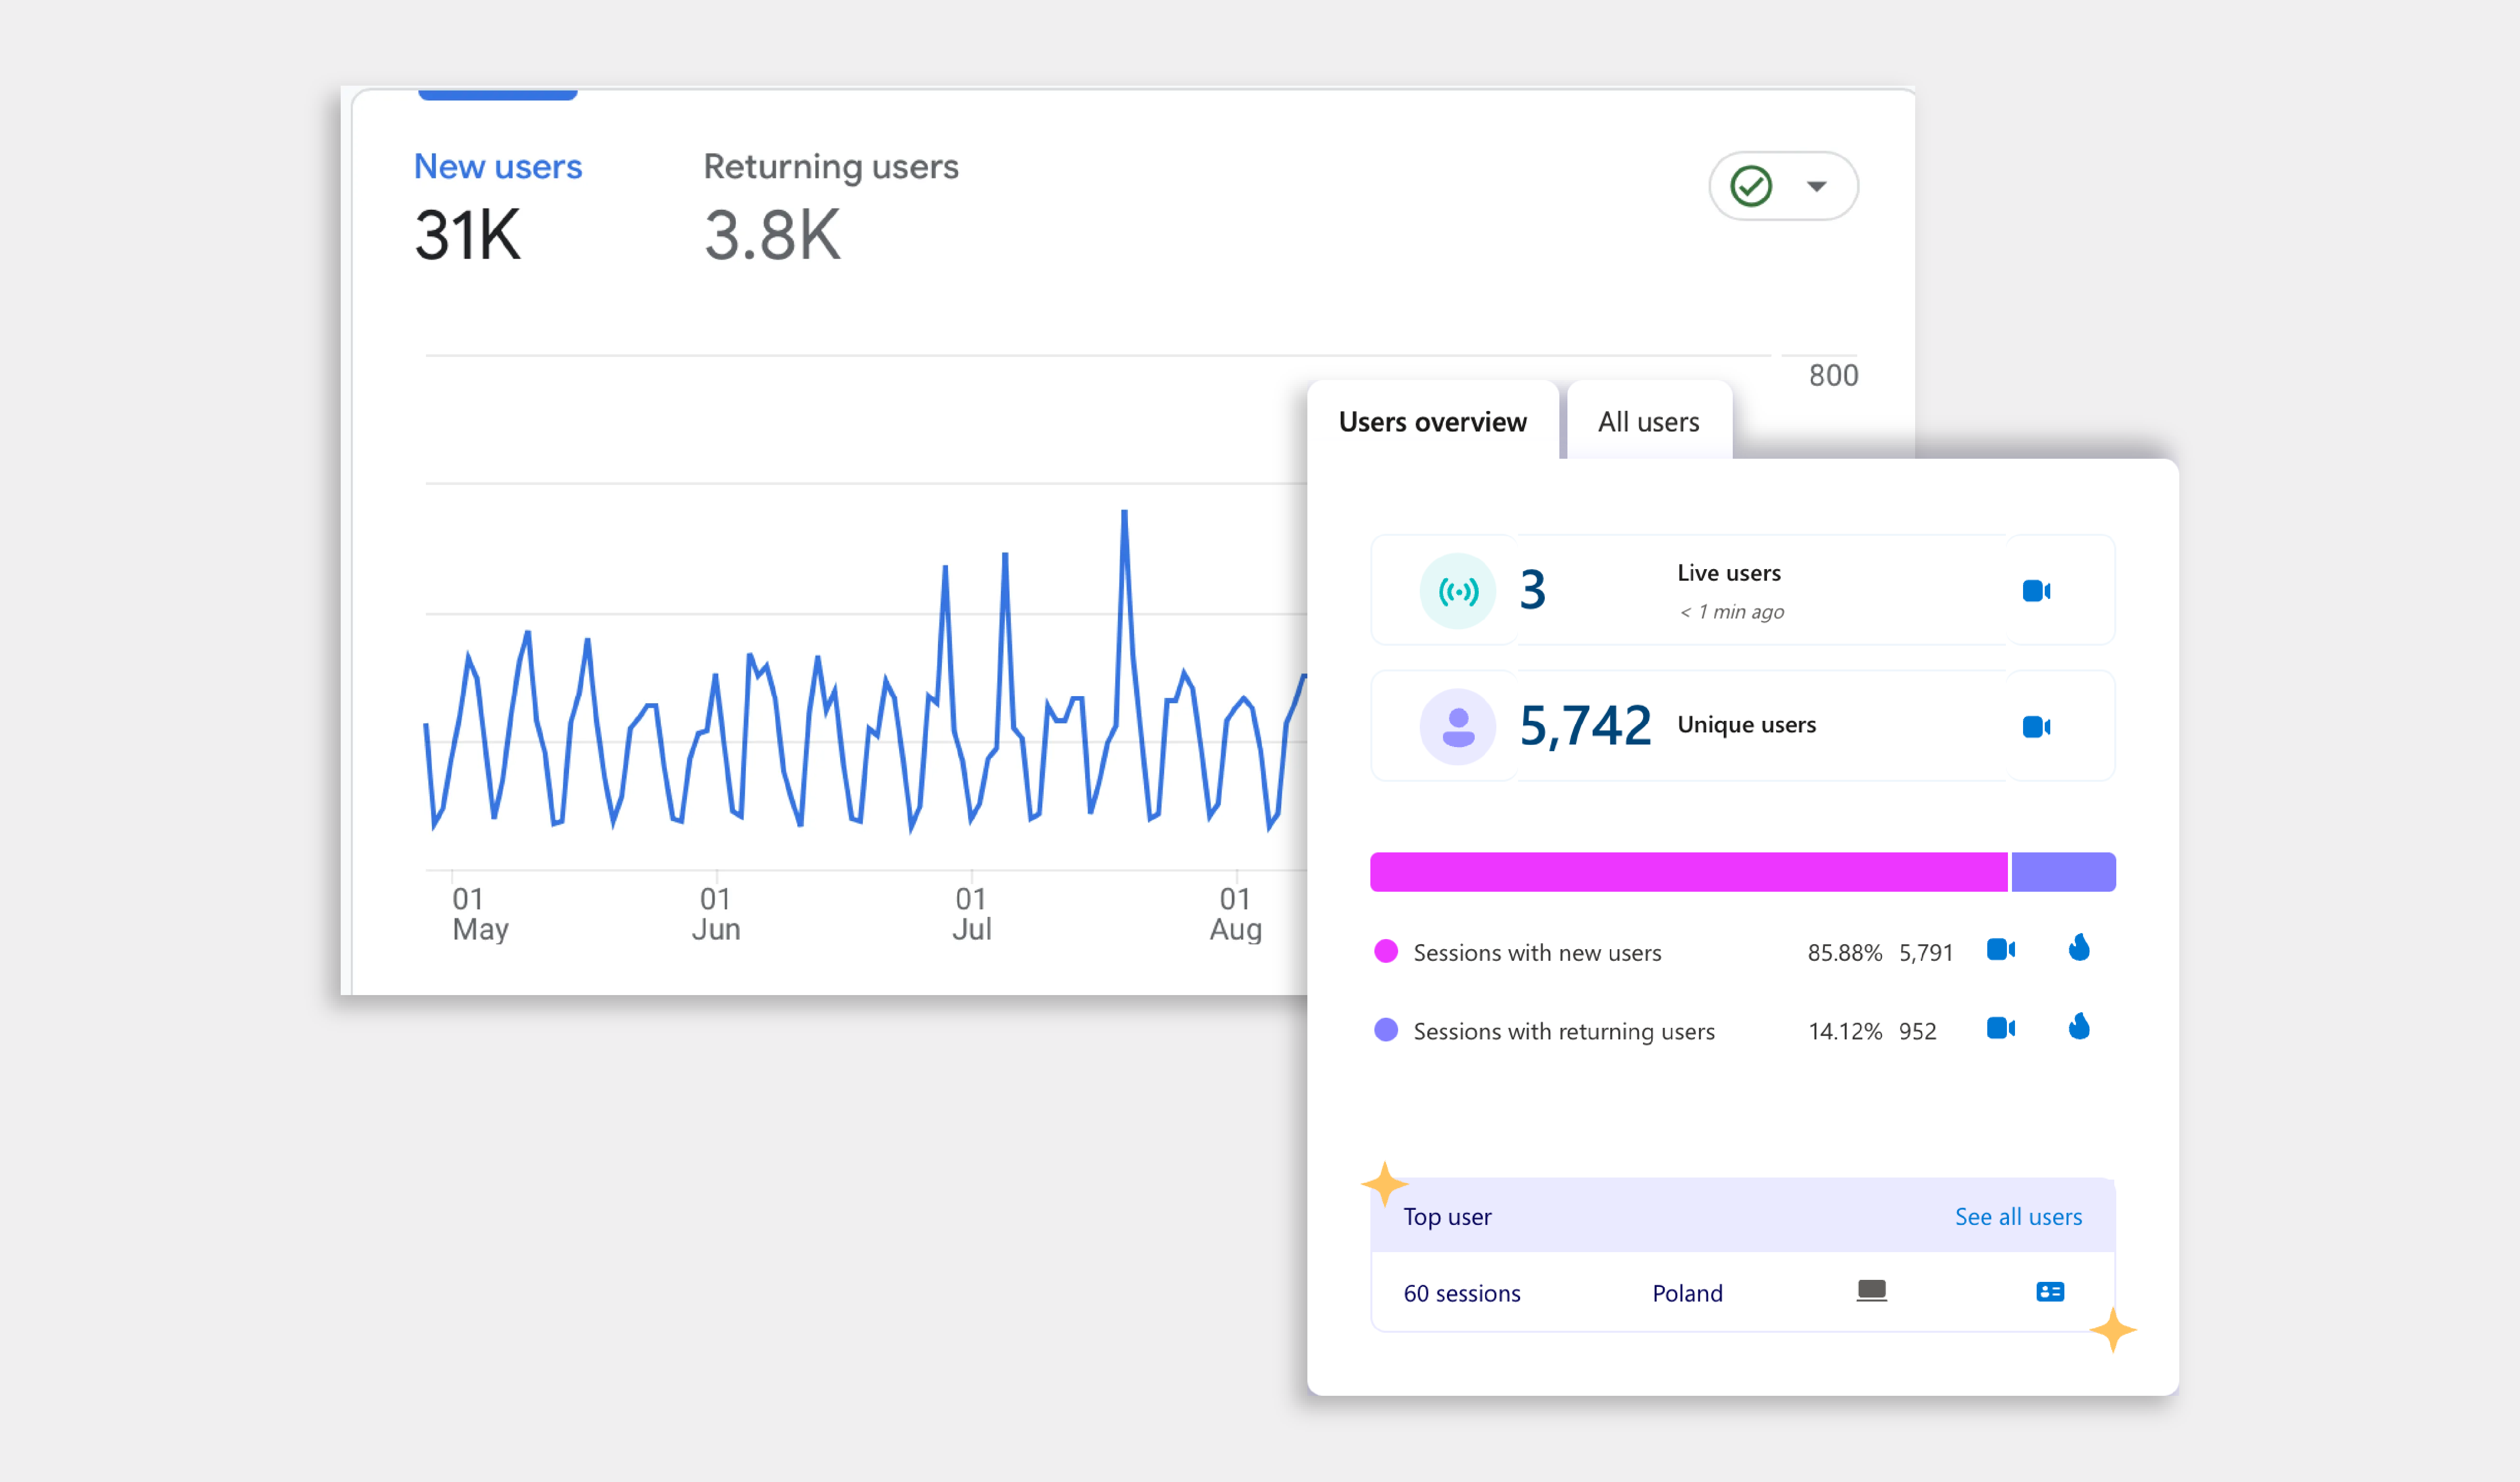
How many users come to my site?
Key data types and where to find them in GA4:
- Total User Count : Google Analytics - Home
- Users’ Session Averages : Reports - Engagement - Overview
- Visiting vs. Returning Users : Reports - Retention
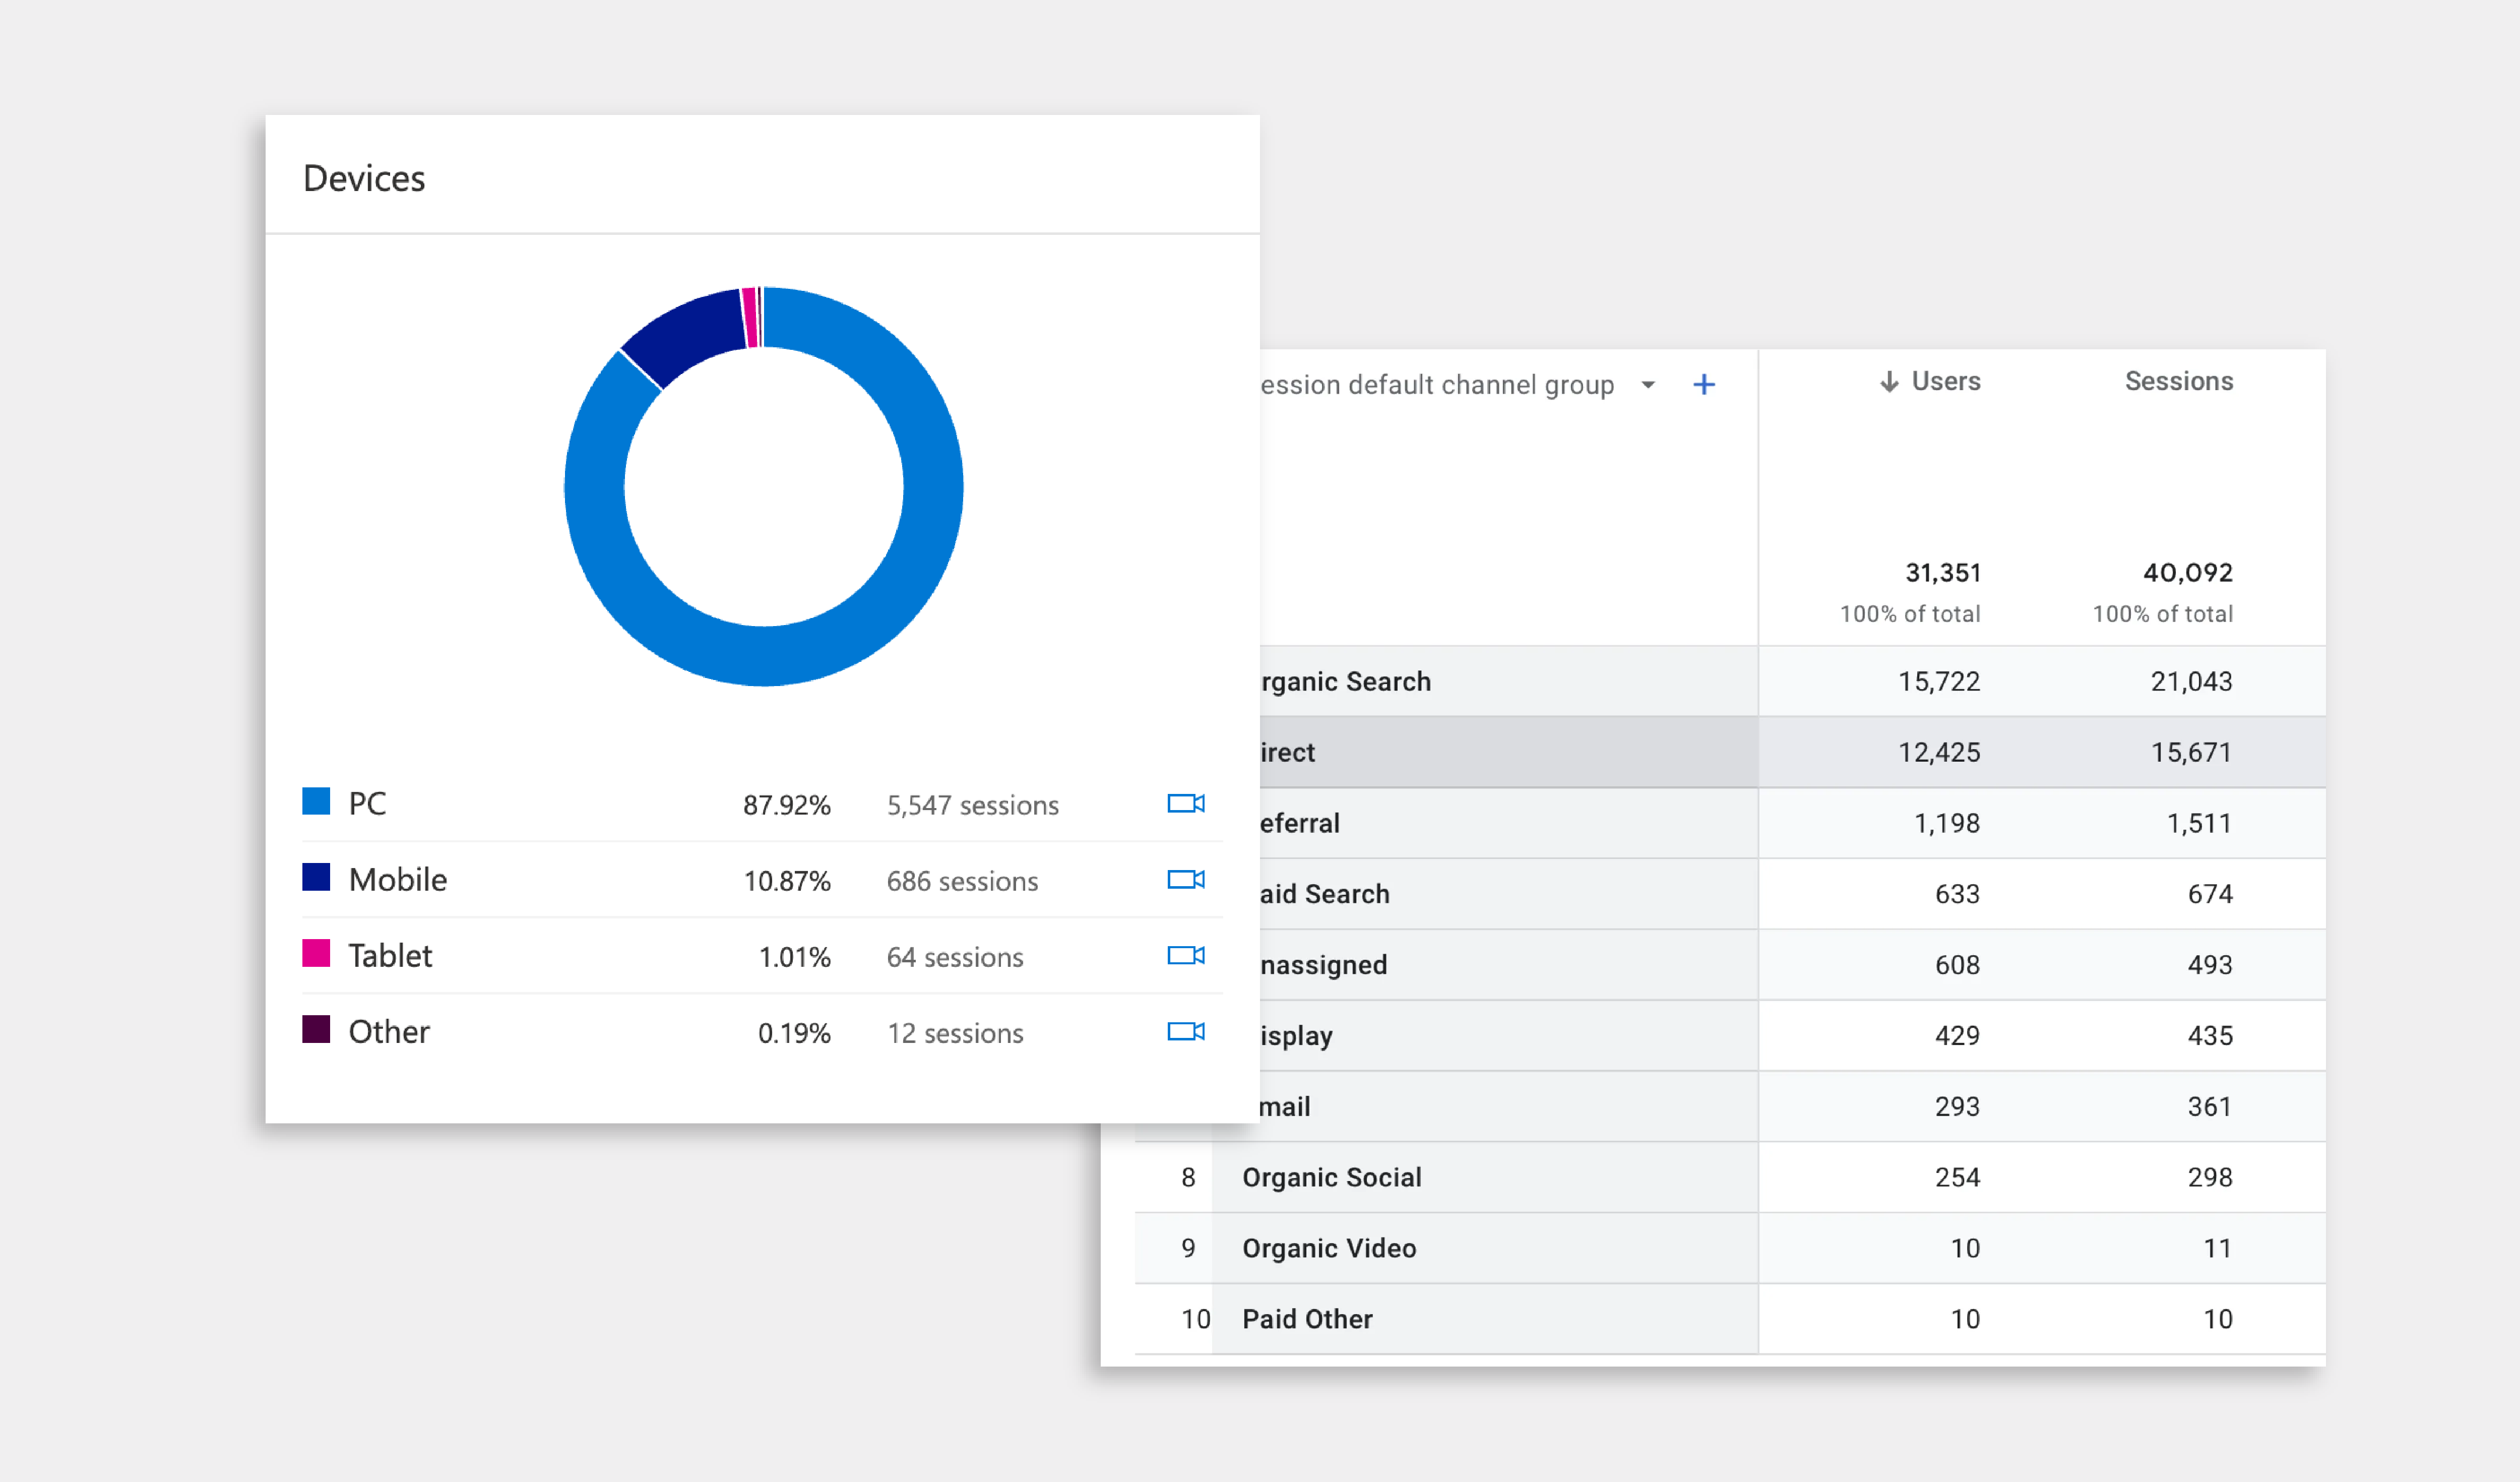
How did they get here?
Key data types and where to find them in GA4:
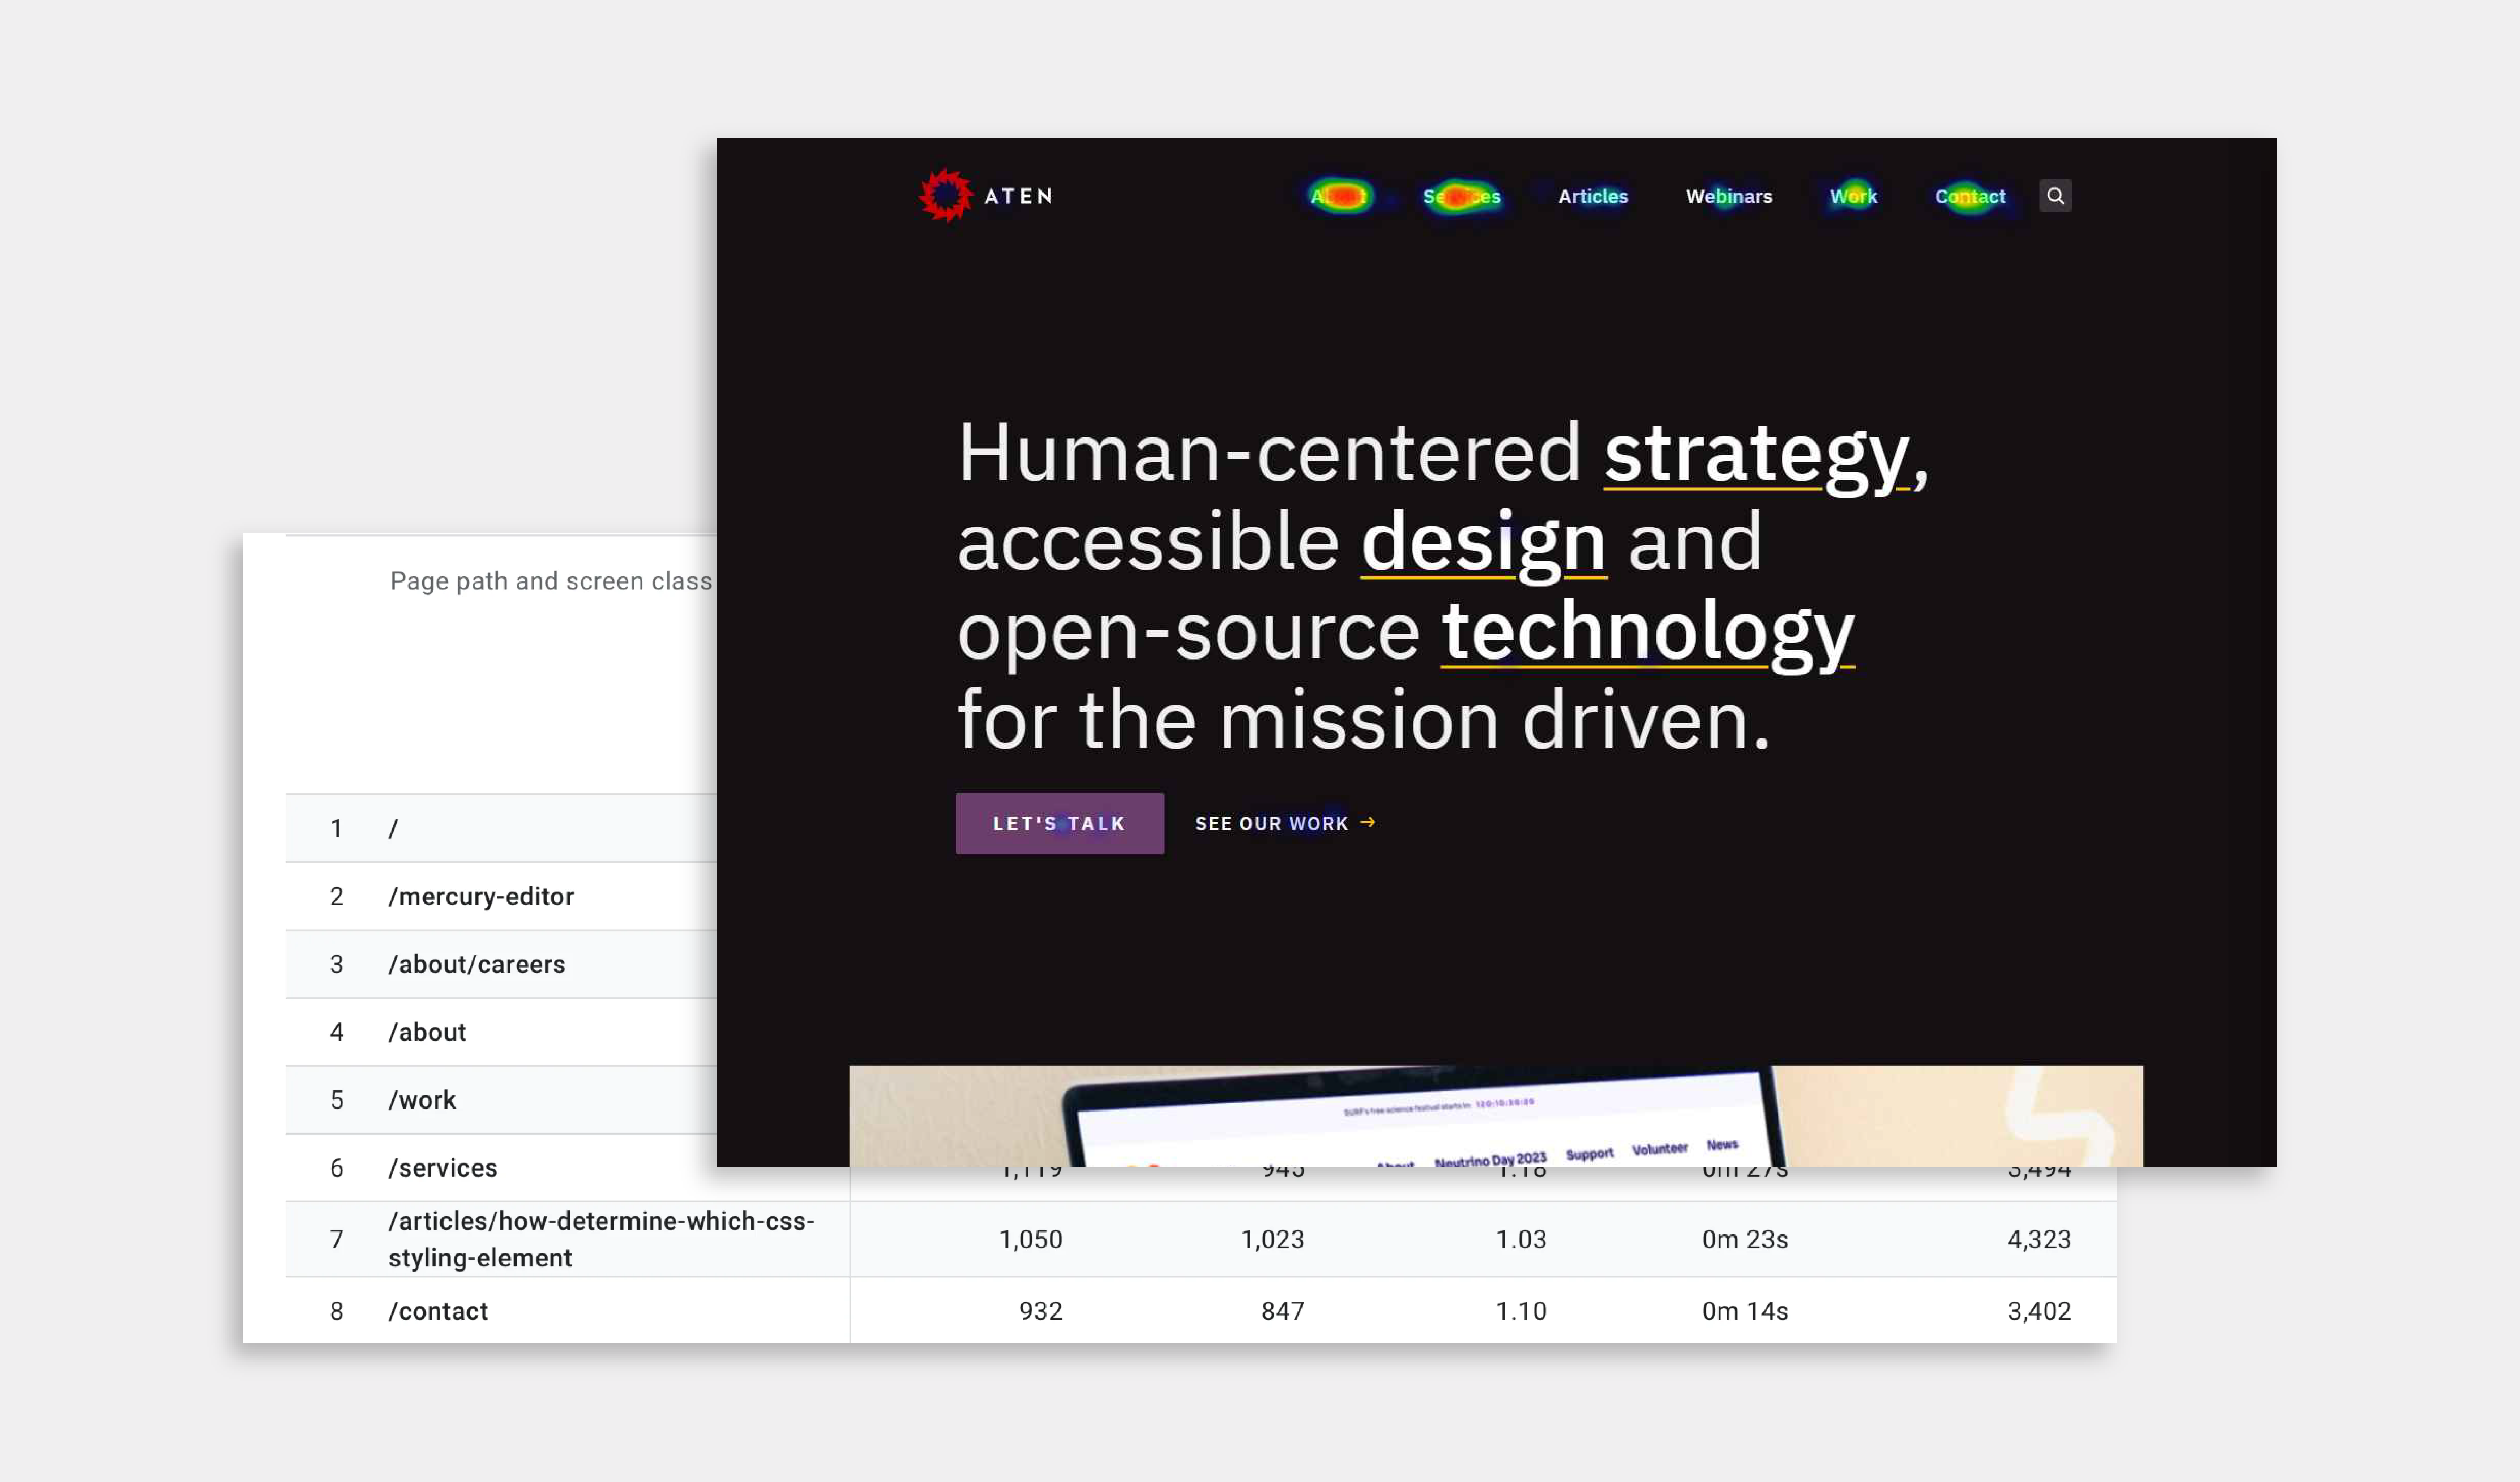
- Devices Used : Reports - User - Tech Overview ; or Microsoft Clarity Dashboard (pictured)
- Browser Used : Reports - User - Tech Overview
- Method of Arrival : Reports - Acquisition
Who are my users?
Key data types and where to find them in GA4:
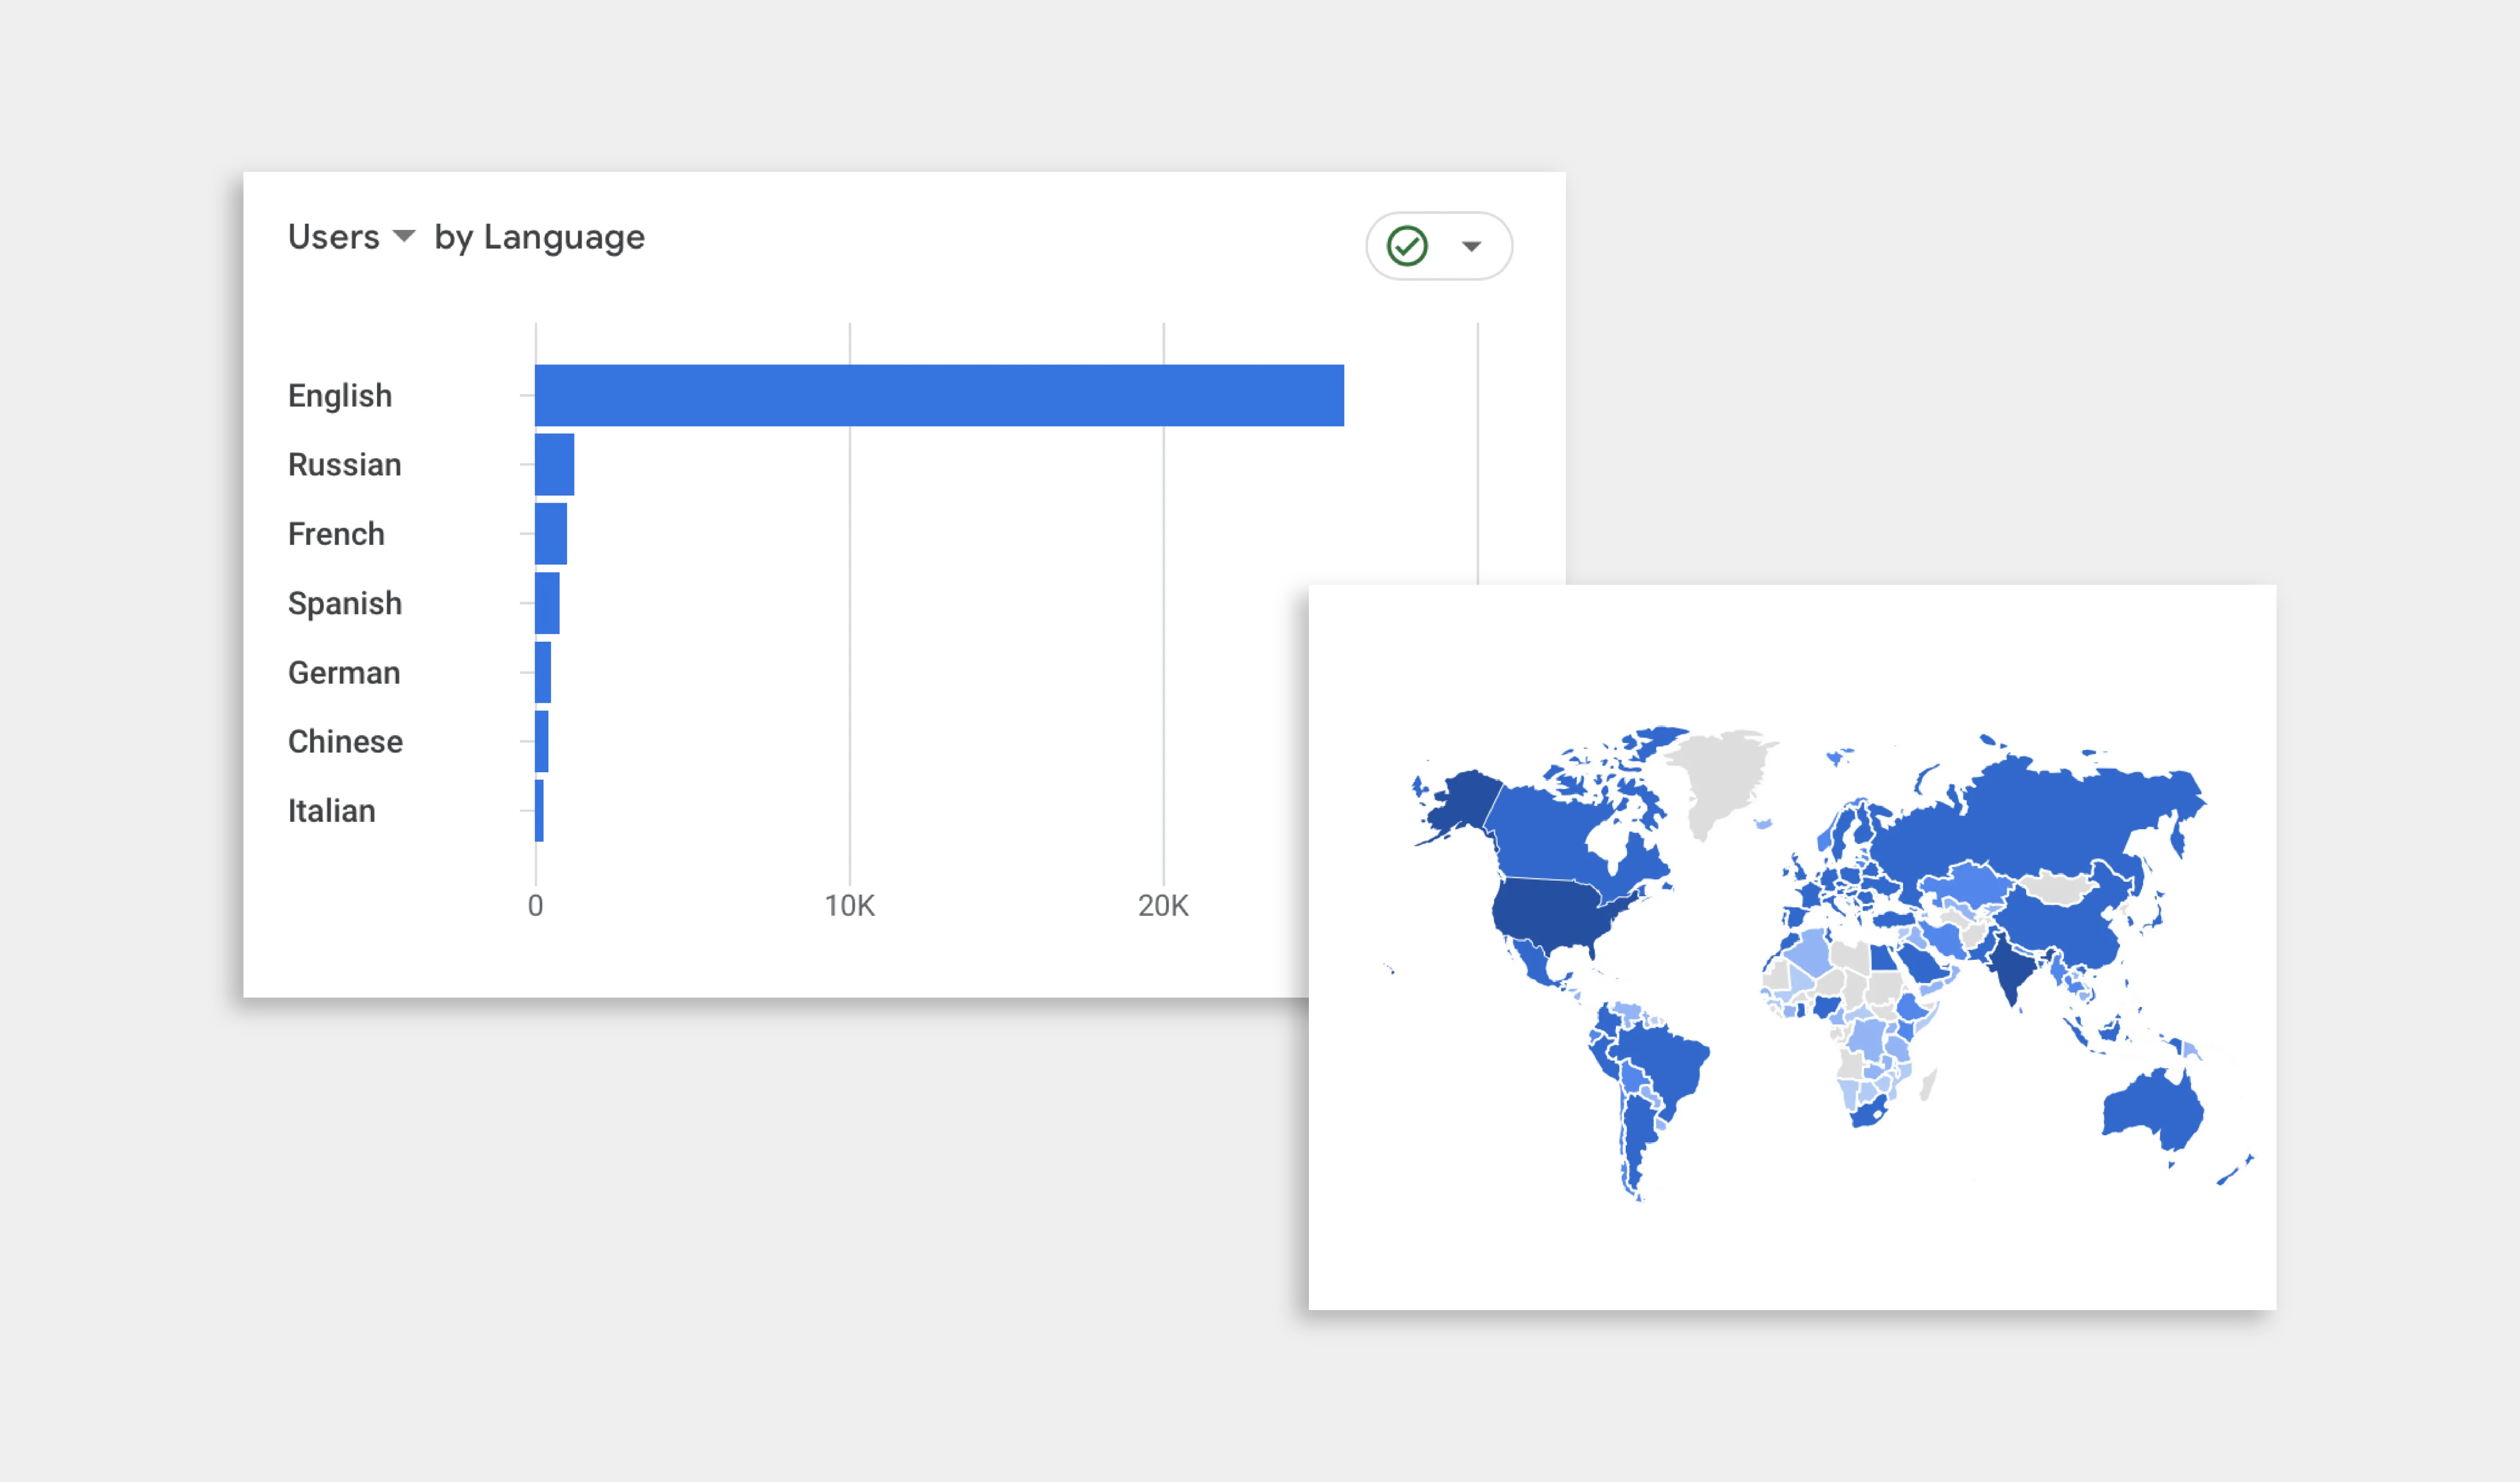
- Location, Language, and Demographics : Reports - User - Demographics
What pages do they visit and how do they browse those pages?
Key data types and where to find them in GA4:
- Site Overview : Reports - Engagement - Overview
- Heatmaps : Microsoft Clarity (pictured, not available in Google Analytics)
How do they move around the website?
Key data types and where to find them in GA4:
- Where Users Arrive : Engagement - Landing Page
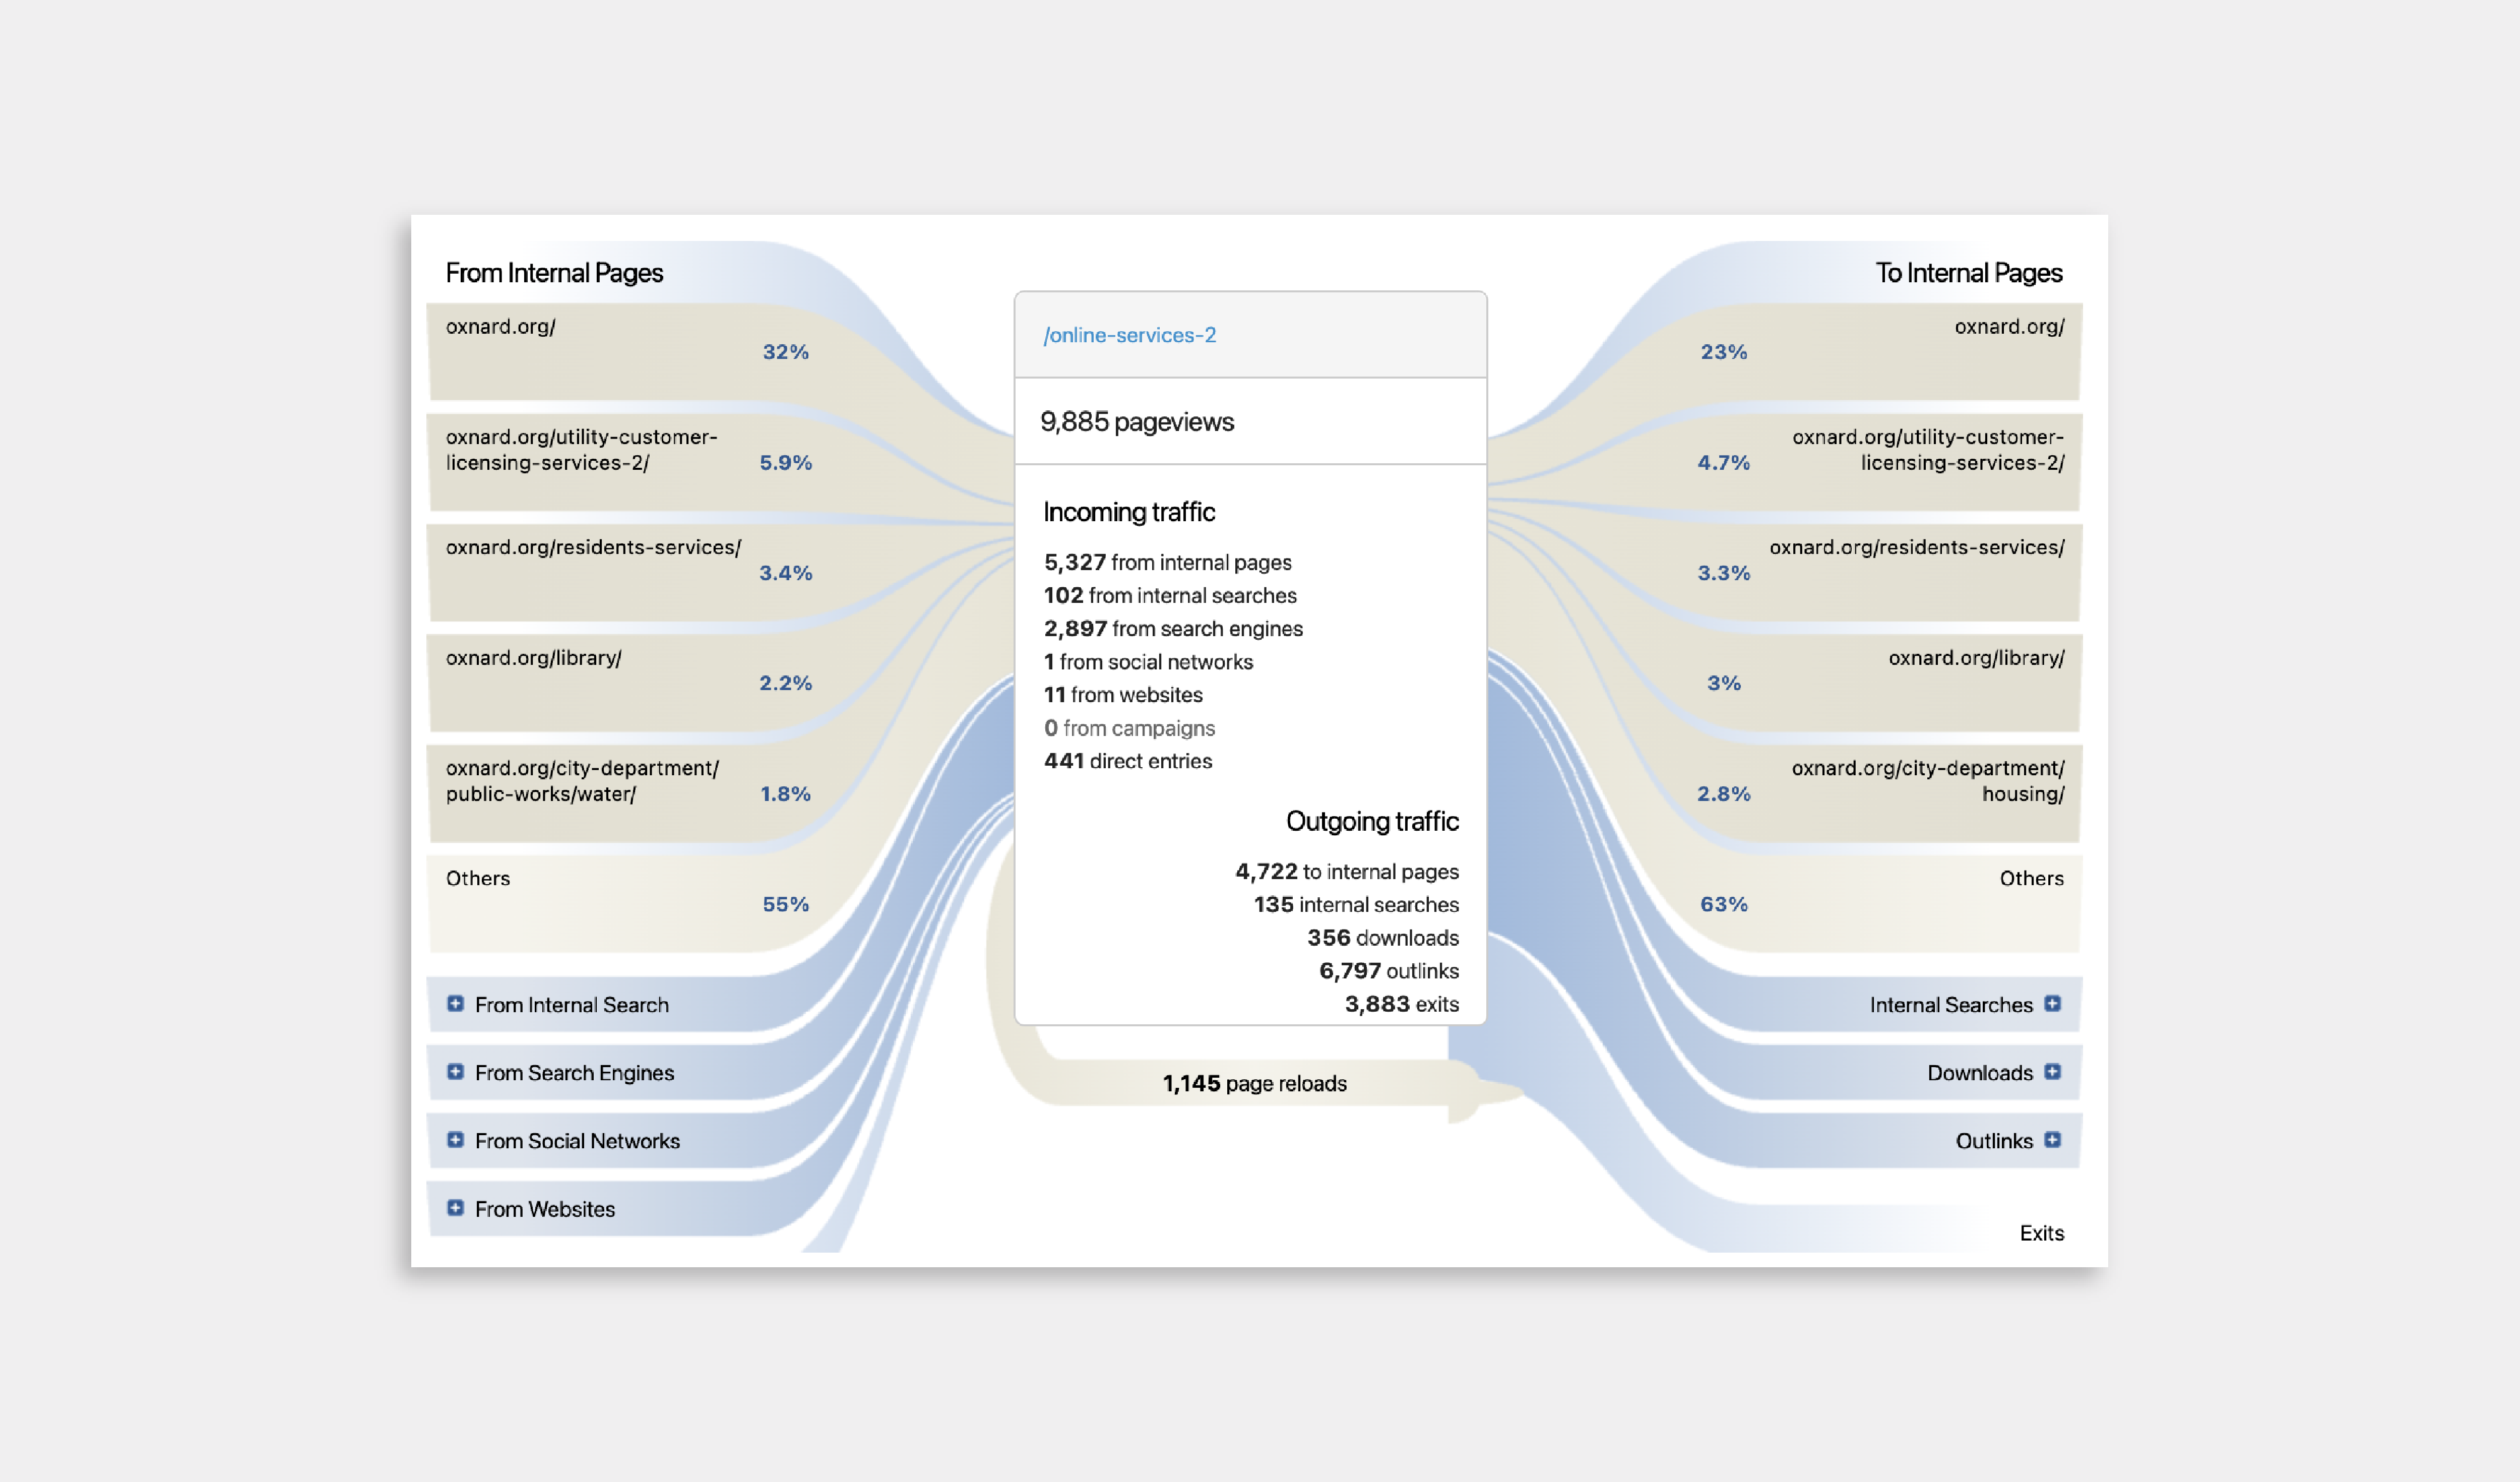
- Behavior Flows : Matomo Traffic Analysis (pictured)
- Note : GA4 also offers Behavior Flows, but they must be configured under “Explore”.
What You Can’t Learn From Analytics
Having the background of your existing site’s quantitative data will give us a lot of helpful insight in the strategy phase of the website redesign process. However, there are a lot of unanswered questions that we can’t garner from analytics data:
- Why are your users doing what they’re doing?
- What do they wish they were doing?
- What are they frustrated with?
- Were they successful in what they set out to do?
- How did they interpret the content you put in front of them?
- What’s the on and/or offline context that brought them to the website?
- Did they enjoy their experience?
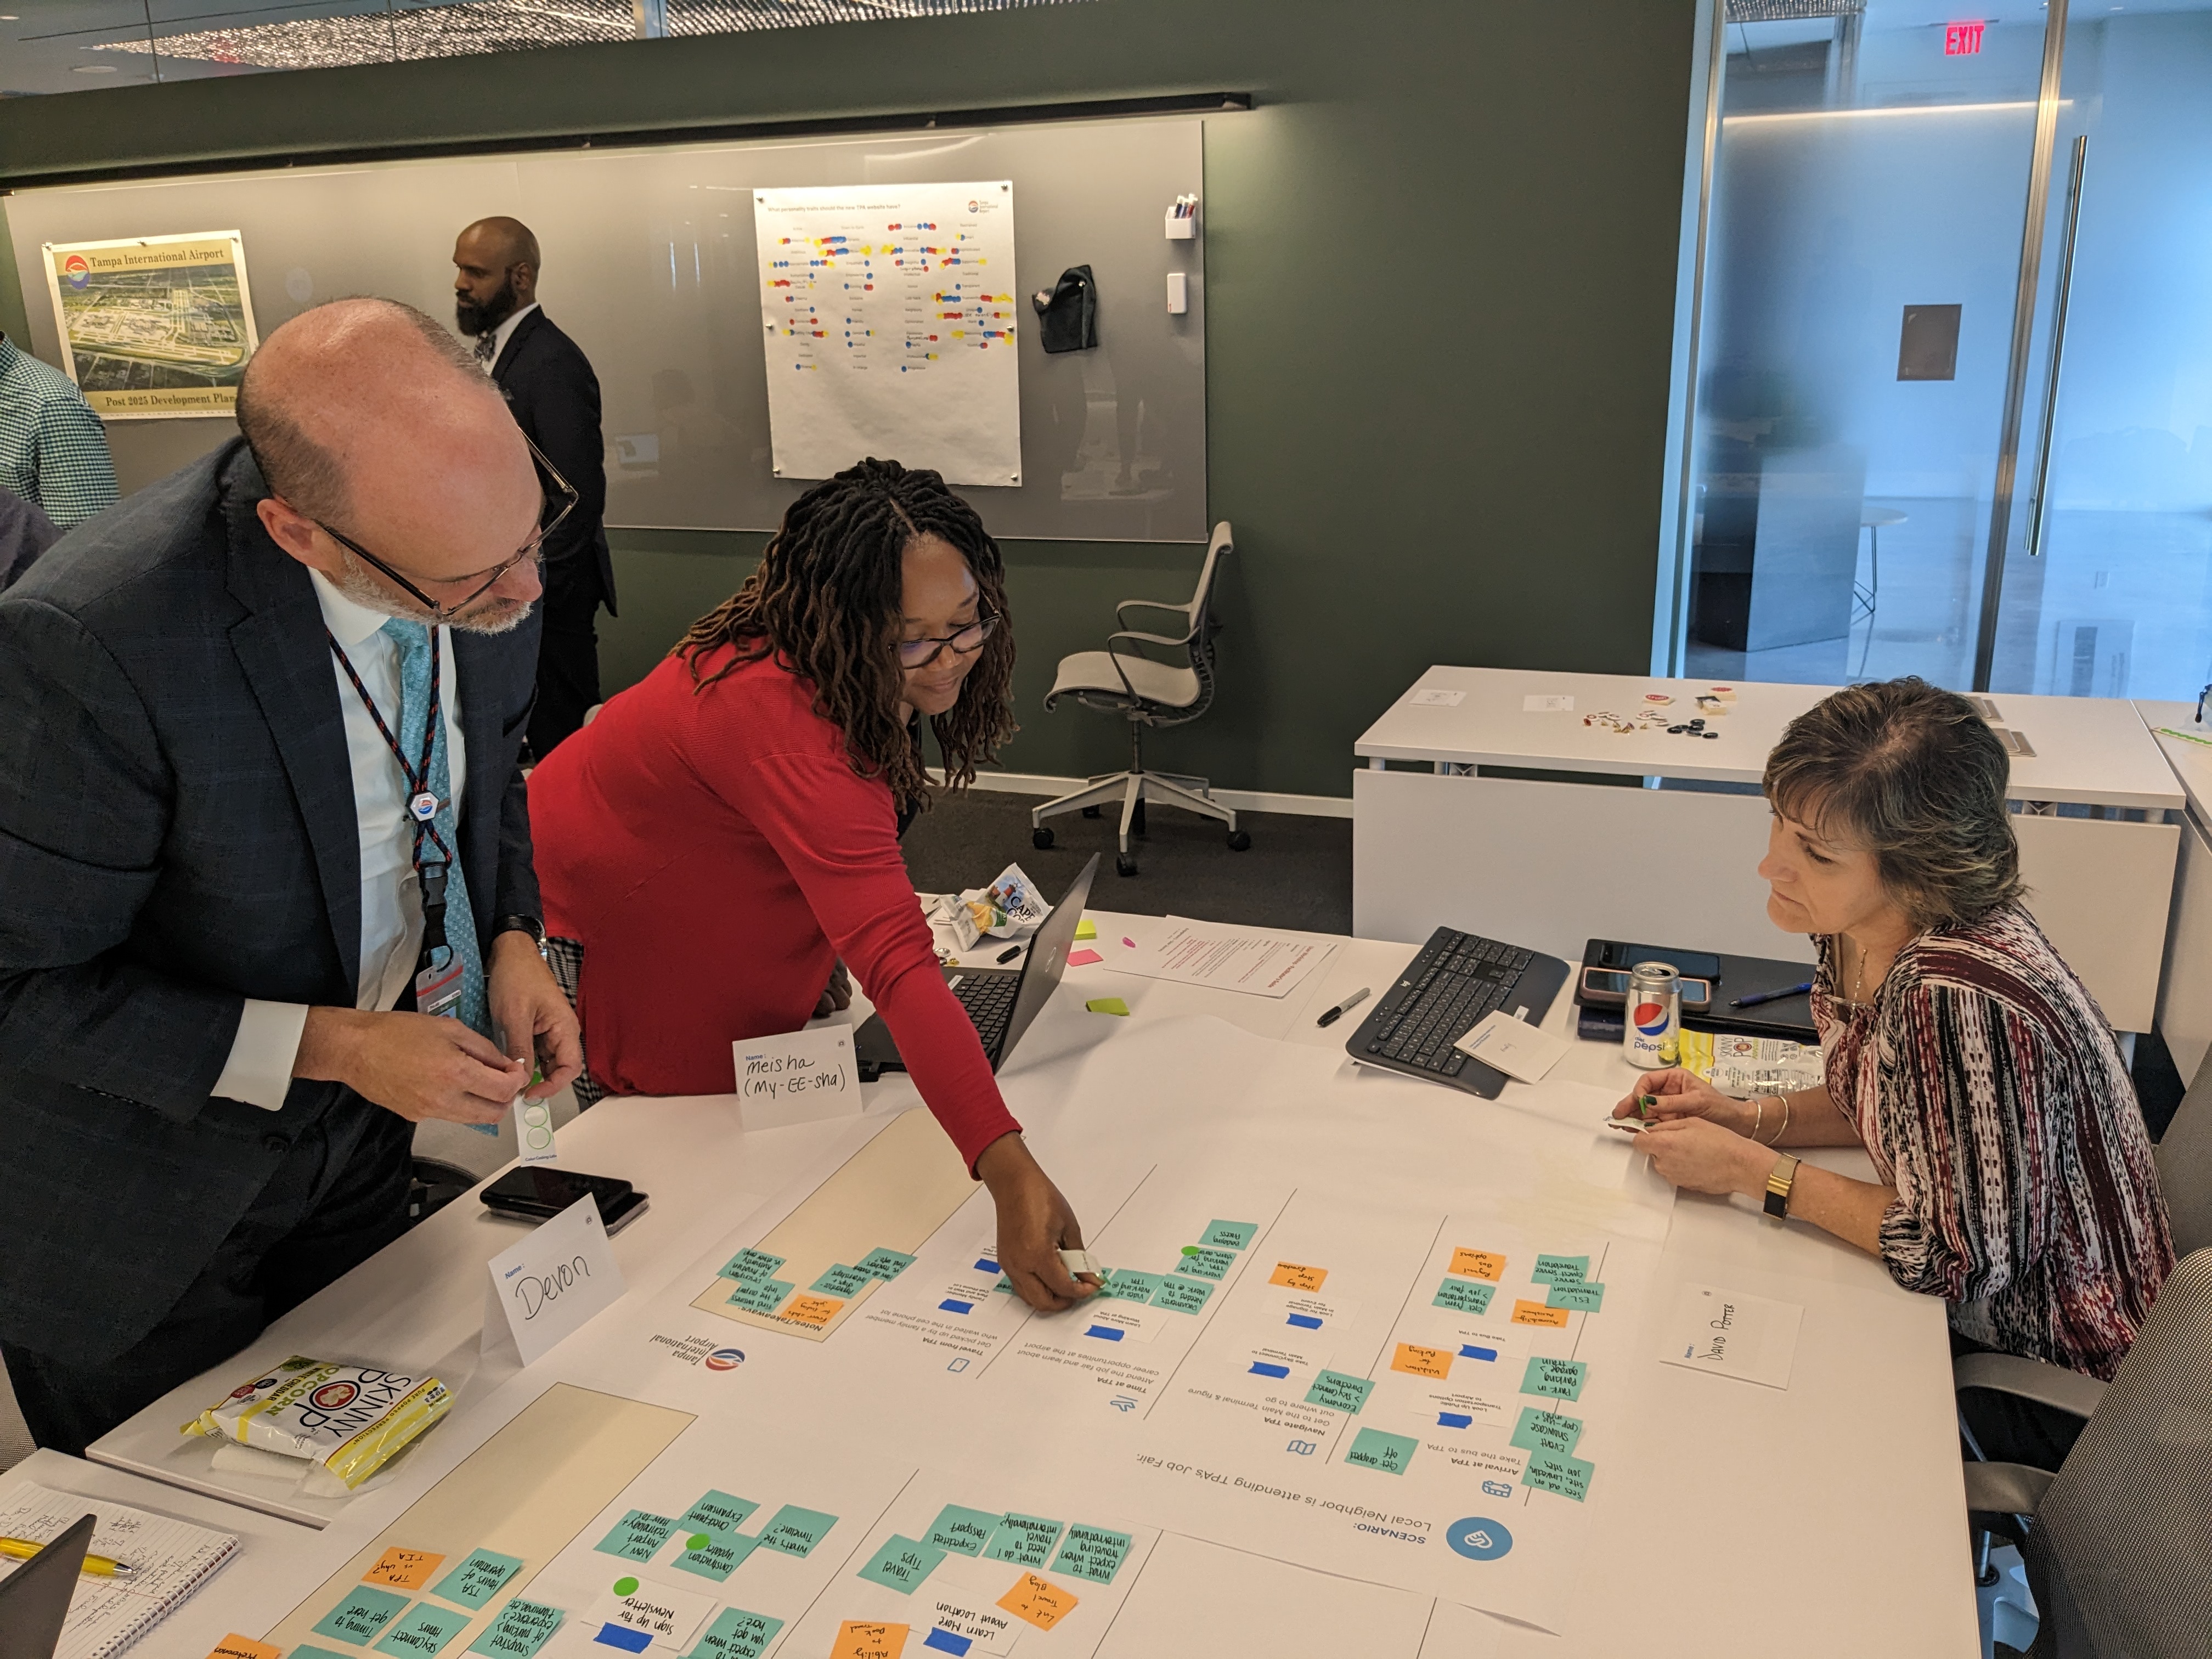
Aten’s strategy phase of each website redesign project can help fill these blind spots with qualitative analysis by conducting user workshops, interviews, surveys, and more.
How to prepare for your website redesign
Whether your website redesign RFP is out or your team is preparing for a redesign in the next year or so, now is the time to start gathering quantitative data about your site’s users. No matter where you are in your website’s evolution, ensuring that you’re measuring content engagement through free tools, such as Google Analytics and Microsoft Clarity, establishes a clear overview of how your site does, or could better, drive impact for your organization.

